

 Tracer
errors.log), turn new lines into structured incidents, optionally deduplicate and escalate them, and deliver alerts to Telegram. This page is about that log tail + classifier + delivery path — separate from HealOps’s own runtime logs.
Developer workflow: the Hermes synthetic suite under tests/synthetic/hermes/ runs offline classifier checks (no LLM, no live infra); you can run that first, then watch a bundled scenario errors.log with healops hermes watch as a small local demo. Optional: enable --investigate to attach the full HealOps RCA pipeline for HIGH / CRITICAL incidents (quickstart).
Telegram delivery uses the same credential model as the rest of HealOps. For
hermes watch, set TELEGRAM_BOT_TOKEN and TELEGRAM_DEFAULT_CHAT_ID (or pass --chat-id). See Telegram.Local demo: synthetic tests, then watch
1 — Offline “investigation” of the classifier (pytest, no Telegram)The Hermes log-classifier synthetic suite feeds real-shaped
errors.log slices through IncidentClassifier and asserts against answer.yml. This is the same regression loop documented in the repo’s tests/synthetic/hermes/README.md:
tests/synthetic/ (includes Hermes and other packages):
Use a scenario’s
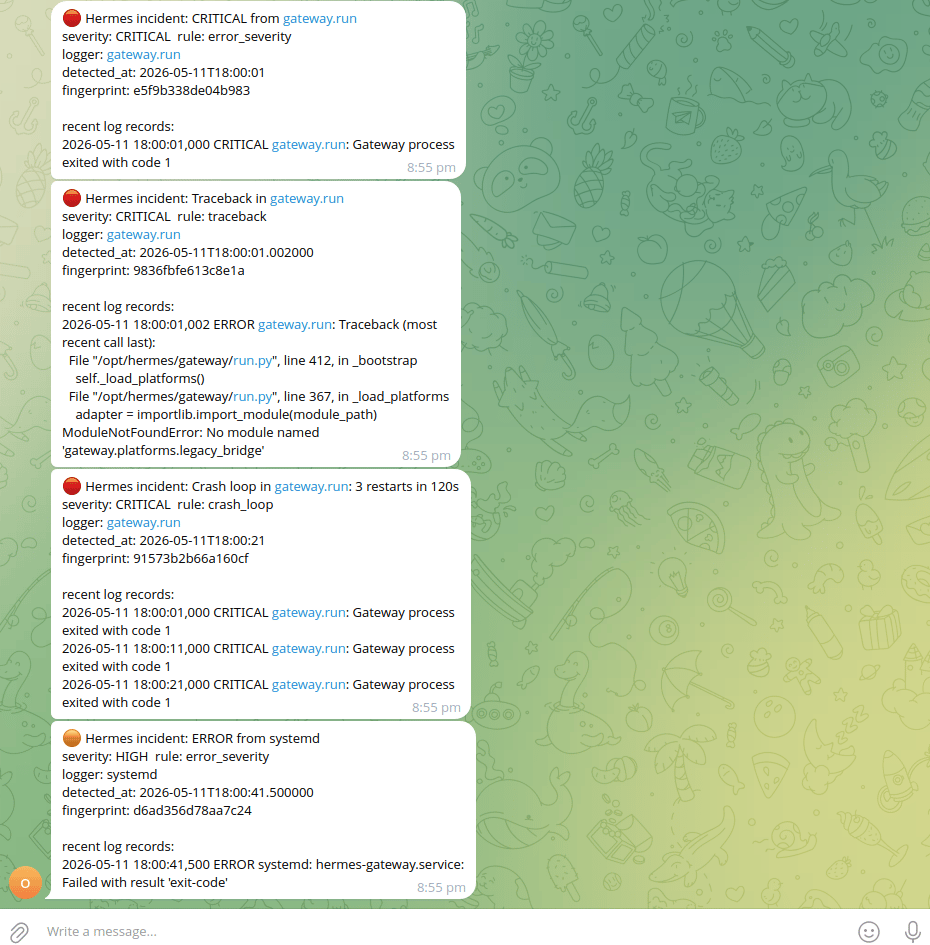
errors.log that emits incidents under default classifier settings (see Quick check with a bundled fixture under CLI: live watch — the 002-gateway-systemd-crash-loop example matches the screenshot there). From the repo root:
--from-start replays the file then keeps tailing — good for a one-shot demo of classification → Telegram. By default, watch only reads new lines, so without --from-start a static fixture produces no events until more lines are appended (use a writable copy of the scenario log if you want to experiment without editing files under tests/). Omit --investigate for a lightweight demo (--investigate runs the investigation pipeline with an LLM for HIGH / CRITICAL only; see below).
What gets monitored
The watcher uses a rotation-safe tailer: if the file is missing at startup, it waits until it appears. Use
--from-start if you intentionally want to replay existing file contents before live-tailing (by default only new lines are considered so Telegram is not flooded on restart).
CLI: live watch
Run from a machine that can read the Hermes log file and reach Telegram:Quick check with a bundled fixture
From the repo root you can point--log-path at a synthetic errors.log. Prefer a scenario with ERROR / CRITICAL lines so incidents fire under the default classifier (the live watcher does not read per-scenario scenario.yml thresholds):
warning_burst needs five warnings from the same logger within 60 seconds (IncidentClassifier defaults). Several synthetic scenarios set a lower threshold in scenario.yml for pytest only; the CLI watcher ignores that file. For example 000-telegram-polling-conflict expects bursts of three warnings — the suite passes, but hermes watch on that file emits no warning_burst incidents, so nothing is sent. Use a log with hard errors (like 002-*) or your real errors.log once Hermes is writing enough warnings.
Correlator dedup can also reduce multiple Telegram sends for the same fingerprint; check shutdown line hermes-watch: correlator metrics delivered=… — if delivered=0, the classifier did not emit any routable incidents for that run.
Common options
Environment variables
Watch with full HealOps RCA (--investigate)
For production on-call, you normally run one long-lived watcher with the RCA bridge when you want LLM-backed summaries on serious incidents:
run_investigation via the Telegram sink. Work runs on a bounded thread pool with a timeout so log tailing stays responsive; MEDIUM and lower stay on a lighter notification path by default.
For ad hoc Hermes log context during another investigation (for example Grafana-driven RCA), use get_hermes_logs below — it samples the log and does not replace a long-running healops hermes watch for continuous classification.
Agent tool: get_hermes_logs
During an HealOps investigation, the planner can call get_hermes_logs to read the same Hermes log in two modes:
op="scan"— one-shot window of the last N lines; returns parsed records and incidents the classifier would emit on that window.op="tail"— incremental, cursor-based reads for “what’s new since last poll?”.
~/.hermes and the parent of HERMES_LOG_PATH when set) so arbitrary file reads are blocked.
Synthetic regression suite
Contributors add scenarios undertests/synthetic/hermes/ (fixtures, scenario.yml, answer.yml). Layout, schema, and “adding a new scenario” steps are in tests/synthetic/hermes/README.md.
Further reading
- Implementation lives under
app/hermes/in the HealOps repository (tailer, parser, classifier, correlator, sinks, CLI wiring). - If you also run OpenClaw alongside Hermes, that page covers the OpenClaw bridge (context lookup and RCA write-back).
- For false-positive risks when rules match both
messageand raw line text, see issue #1874.