> ## Documentation Index
> Fetch the complete documentation index at: https://docs.healops.ai/llms.txt
> Use this file to discover all available pages before exploring further.
# Integration Workflow
> Choose the right framework integration for your workflow
Tracer seamlessly integrates with a wide array of workflow managers, schedulers, and scripting environments.
Choose the integration that best matches your pipeline infrastructure.
## Common Integration Steps
Regardless of your framework, Tracer integration follows these simple steps:
Start the Tracer agent with your organization token
`sudo tracer init --token `
Go to our [onboarding](https://app.healops.ai/dashboard) to get your own personal token
Execute your pipeline as usual, Tracer automatically monitors all processes.
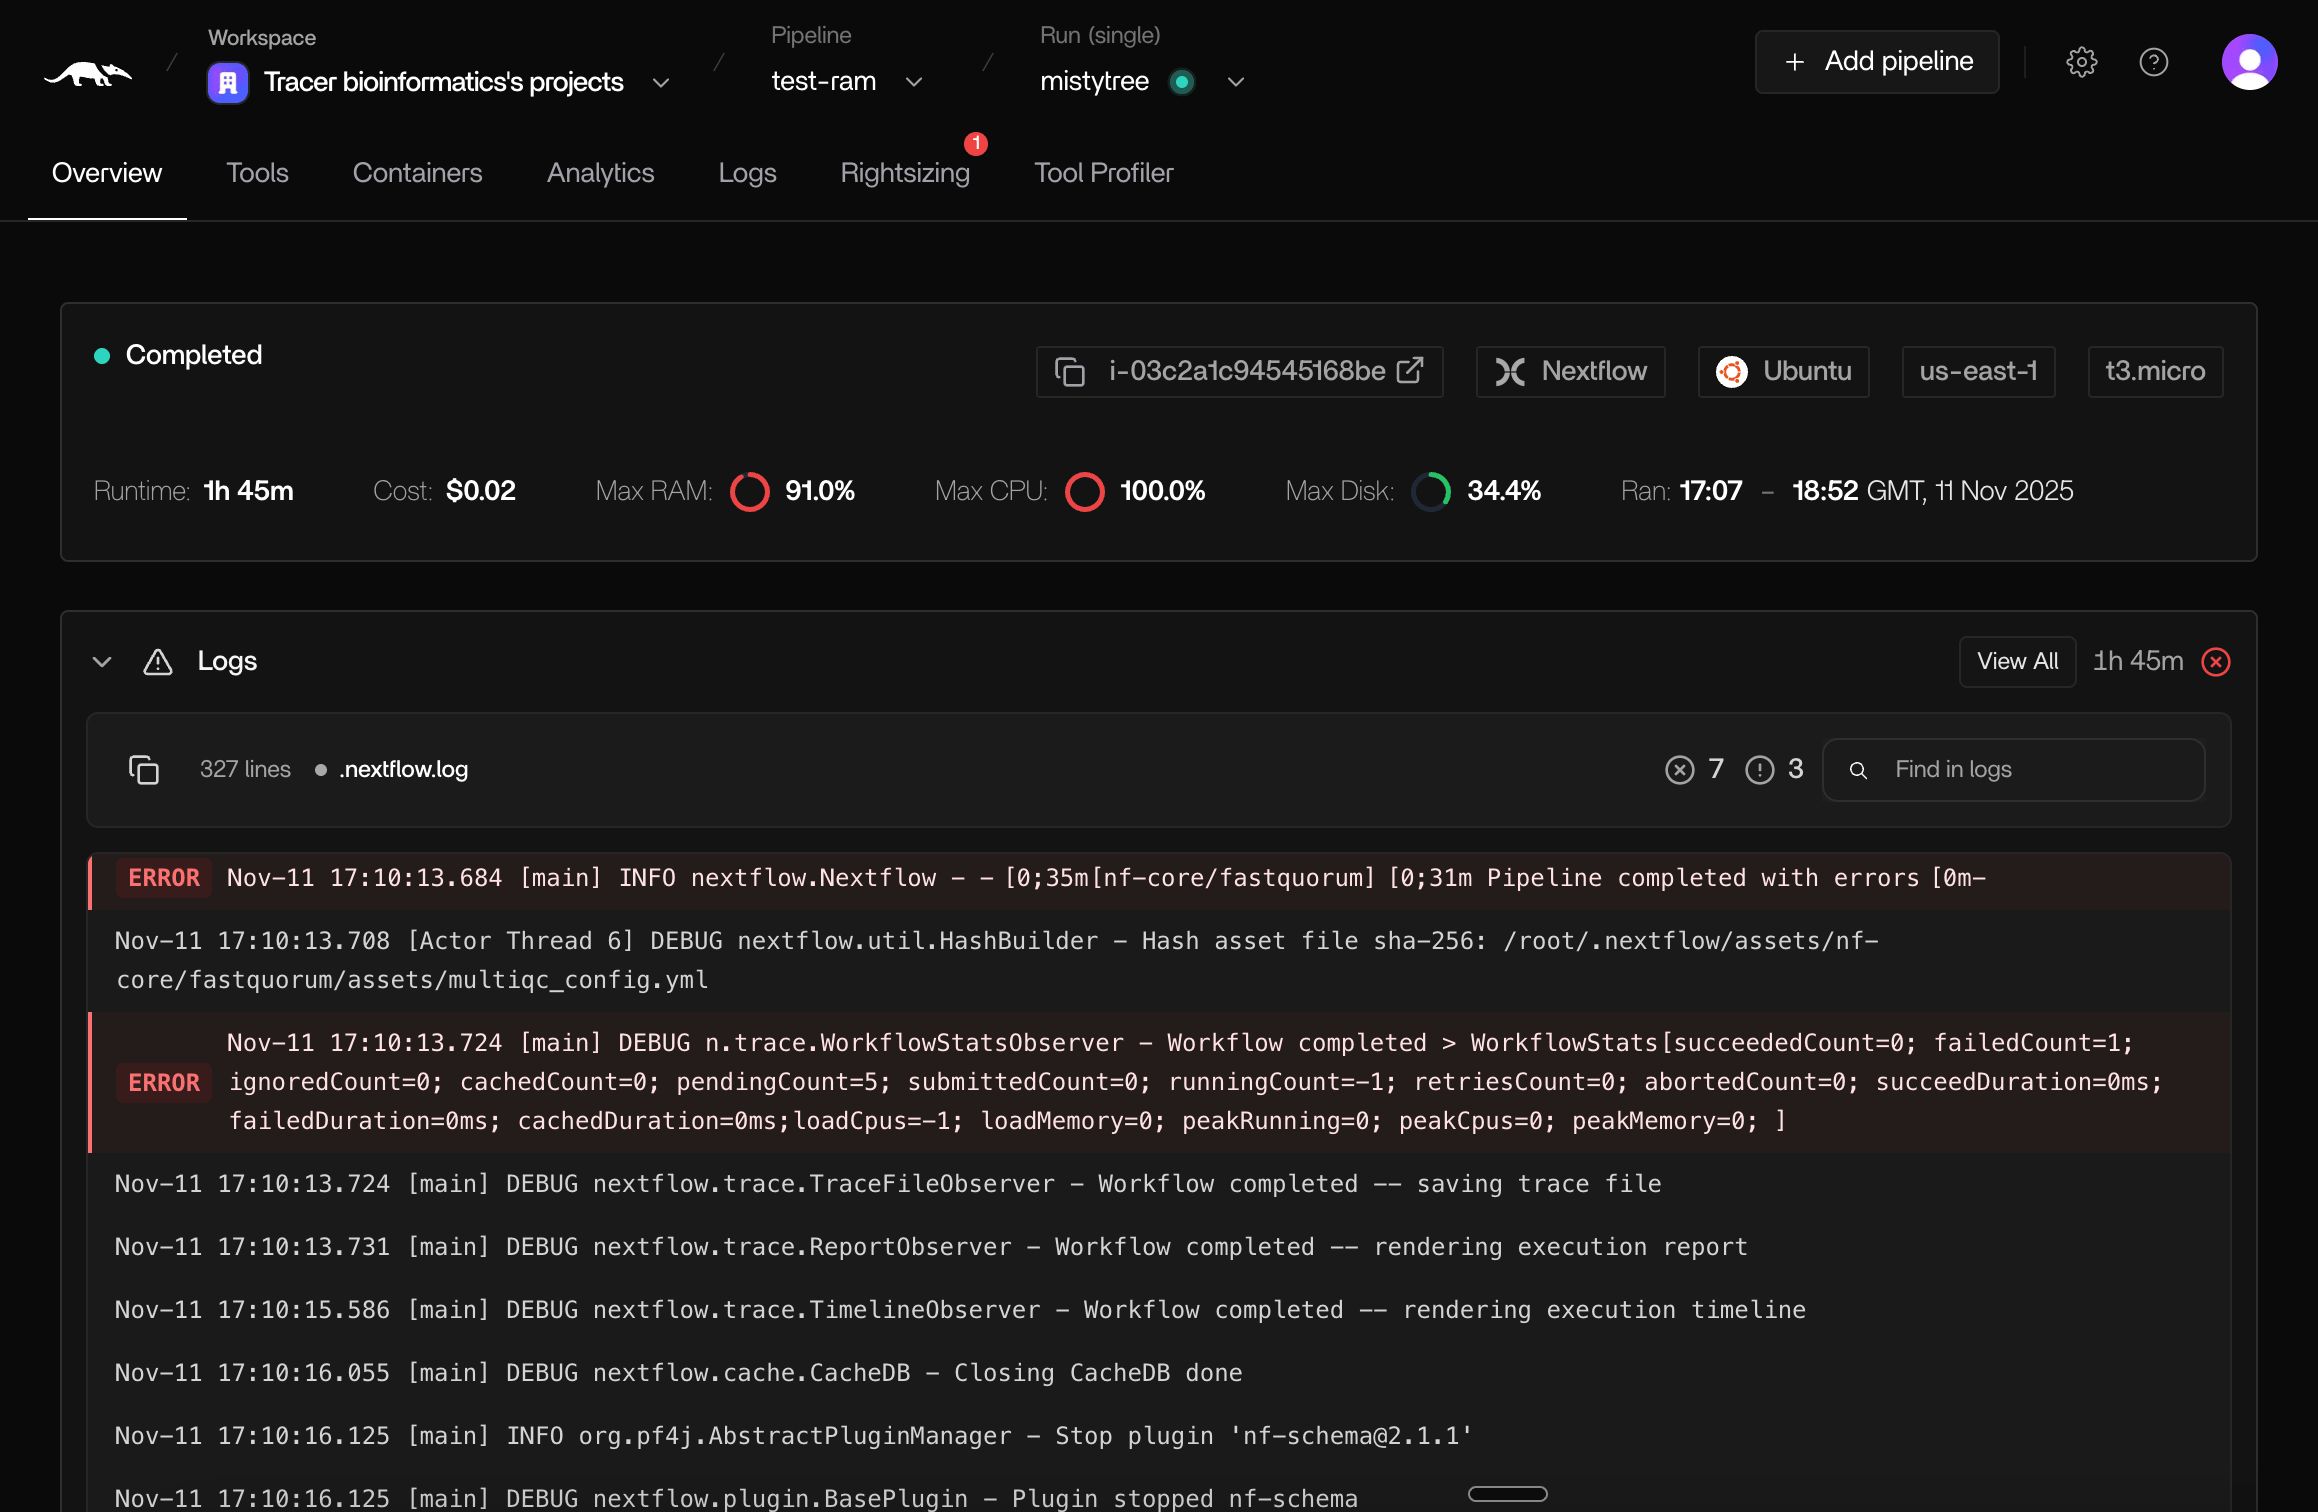
-> Monitor your pipeline run in [the Tracer dashboard](https://app.healops.ai/tracer-bioinformatics)
## Verify Delivery
Check the [Tracer dashboard](https://app.healops.ai/) for real-time insights
 ## Key Features Across All Integrations
* **Zero Code Changes** - No instrumentation required, works at the system level
* **Real-Time Monitoring** - See your pipeline execution as it happens
* **Resource Tracking** - CPU, memory, I/O, and network metrics per process
* **Cost Attribution** - Understand the cost of each pipeline step
* **Execution Graphs** - Visualize dependencies and execution flow
* **Performance Insights** - Identify bottlenecks and optimization opportunities
## Key Features Across All Integrations
* **Zero Code Changes** - No instrumentation required, works at the system level
* **Real-Time Monitoring** - See your pipeline execution as it happens
* **Resource Tracking** - CPU, memory, I/O, and network metrics per process
* **Cost Attribution** - Understand the cost of each pipeline step
* **Execution Graphs** - Visualize dependencies and execution flow
* **Performance Insights** - Identify bottlenecks and optimization opportunities